How can I display my well data in 3D?
Activate a 3D View or create a new 3D View. In the JewelExplorer check the wells and logs you want to visualize. Log data is visualized along the wellbore in the 3D View. You can alternate between 1D and 3D visualization of the data by right-clicking the log in the JewelExplorer and adjusting the Display Settings > 3D Log option. When displayed in 3D, the log values determine the shape and color of the log in the 3D View.
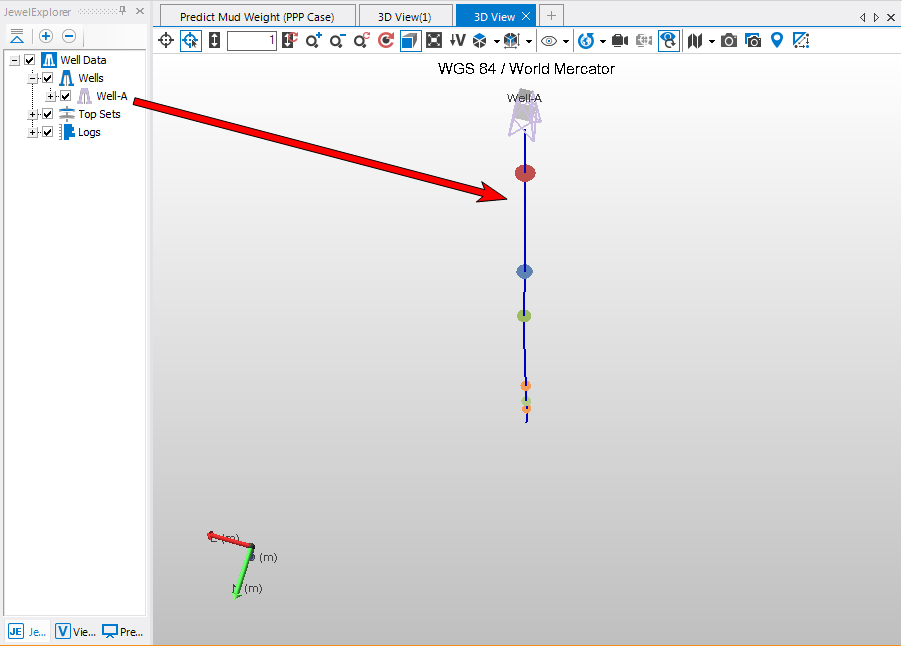
click to enlarge
If the 3D mode is disabled on your computer, then your graphical card does not support the 3D log rendering option. Try upgrading your display driver if switching hardware is not an option.